| Layer | Metric | What It Tells Us | Why It Matters |
|---|---|---|---|
| Application / Network | takumi_auto_cross_ping_latency_ms | End-to-end latency across region boundaries (Gateway → Mediary → Target). | Detects cross-region degradation or routing issues early. |
| Infrastructure / Host | node_cpu_seconds_total (transformed to CPU%) | Resource usage on Mediary hosts handling cross-region traffic. | Detects CPU saturation that could cause packet queuing, throttling, or latency spikes. |
| Derived View | Combine both in Grafana (latency vs CPU) | Correlate infra load with latency trends. | Tells us why latency increased — infra issue vs network path vs target region. |
Interview Talking Point
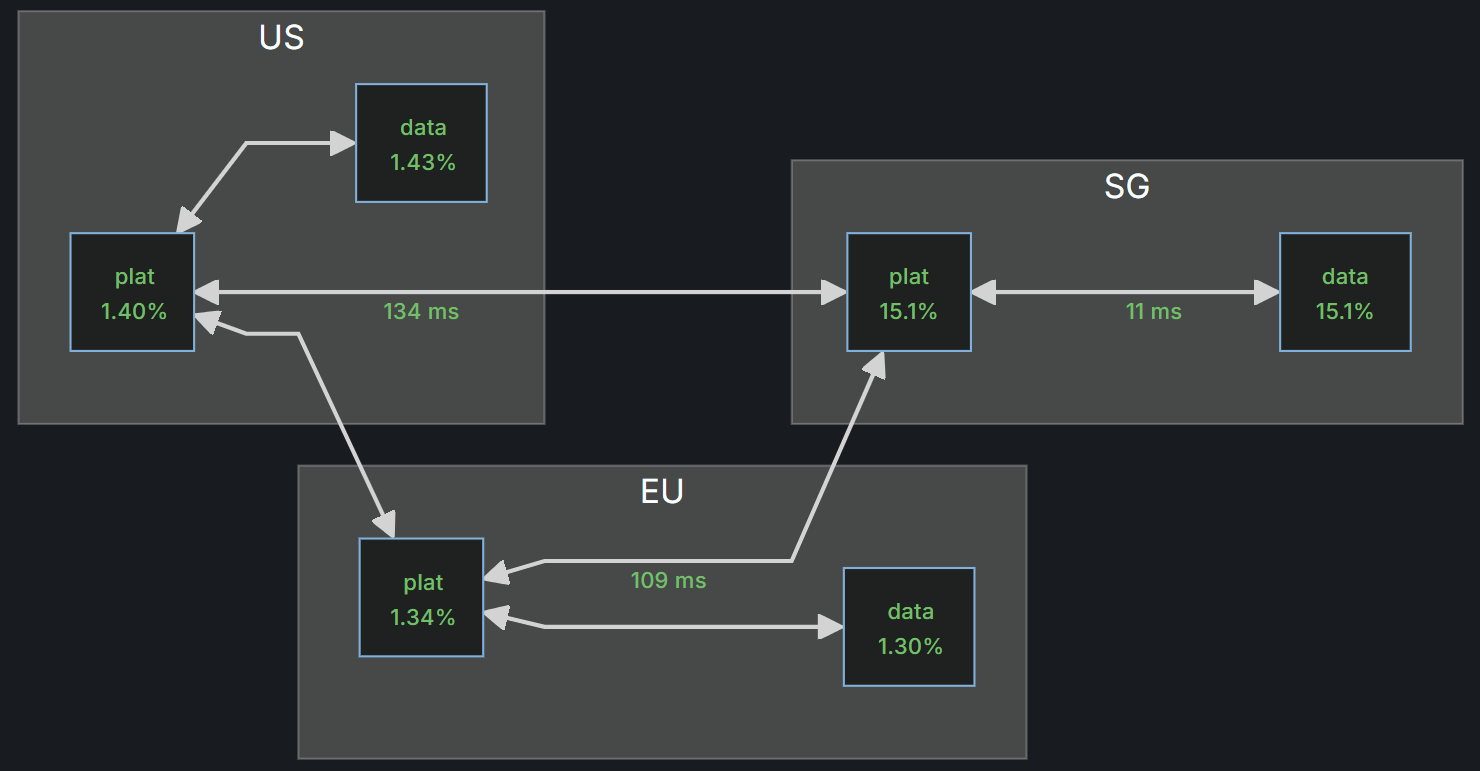
We expose both cross-region latency and Mediary resource metrics to Prometheus, which gives us a real-time view of how our regional services communicate.
When a route’s latency spikes, we can immediately see whether it’s a network, proxy, or compute issue — turning what used to be a black-box latency complaint into actionable observability.